
It's been an active start to month in the capital with earthquakes shaking things up in Wellington and surrounds. We've been able to provide dozens of buildings and response teams with data to put people at ease and guide the next step in the earthquake plan. We've received reports of some minor non-structural damage, and a few engineer callouts have been prompted. In contrast, one facilities manager was happy to share she had a relaxing Sunday morning cheese scone while Sentinel guided the team of exactly what had happened at their buildings, and exactly what they needed to do! We love hearing our Sentinel service is reducing the uncertainty associated with earthquakes and aftershocks and empowering the response process with measured data.
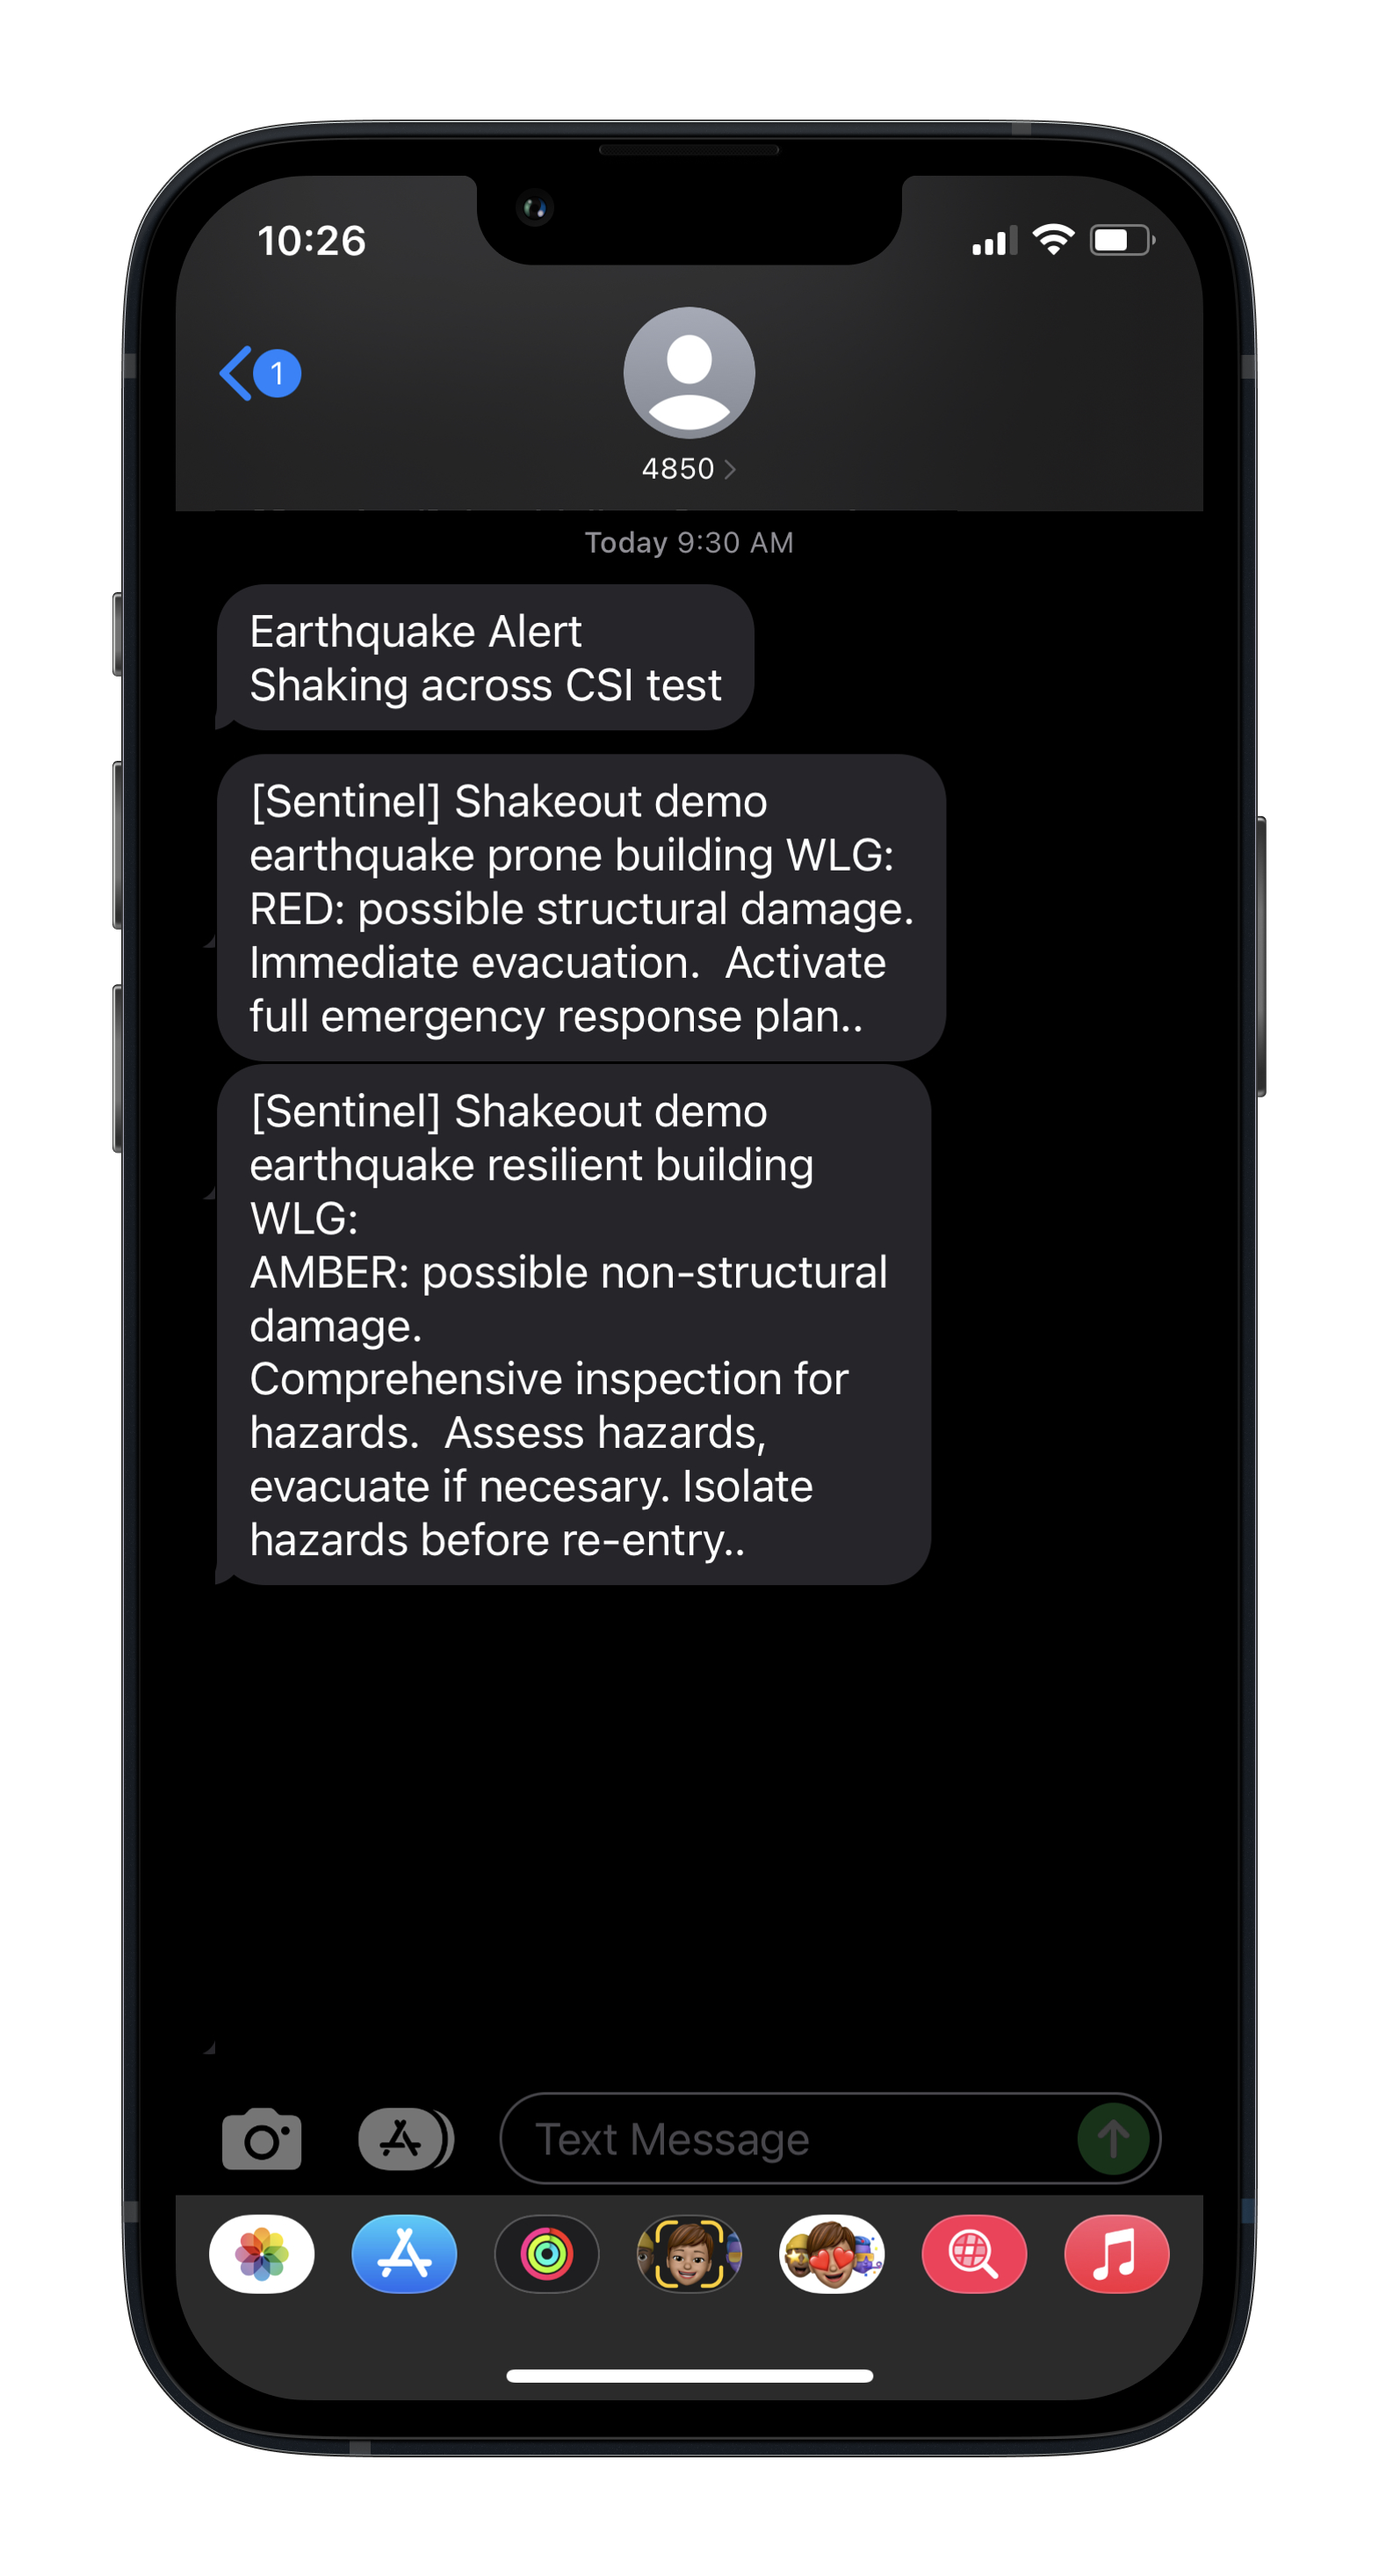
The following images show what the Sentinel experience is like. There is an Earthquake map, a building list, and individual building reports...


We report on each building in your portfolio, so if you have several, the summary reorganises based on impact, most to least, so you know where to start. The earthquake map image is the actual event from Sunday morning, based on the earthquake measurement by our friends at GeoNet. We then use that to put the measurements at your buildings in context. You can see in our demonstration examples of what red, amber, and white level shaking looks like comparted to a building, and the App response. Each building has a customisable recommendation for each level of shaking, so your response team know exactly what to do, from your Earthquake Response Plan. Those levels are prescribed for each individual building, and you can see in the chart's different amber and red tolerances per building. When the measured shaking crosses an alert level, the tiles in the App change colour, and we notify you and your authorised stakeholders too, Email and SMS as well as App notifications are options.
Drop, cover, hold - then check Sentinel
When the shaking starts your first action is drop, cover, hold. If you are inside a tsunami evacuation zone, and the event is long and strong, get gone. These are the guidance of earthquake authorities in New Zealand and your best immediate response. Once the shaking stops, a subscription to Sentinel will guide decisions about what to do next. With pre-set building characteristics, we compare the measured shaking with building tolerances based on the New Zealand Building Code (New Building Standard - NBS) and deliver this to you within seconds of the event. Use this data to choose your next step - manage the response internally or seek professional advice. Always have the next steps in your response plan ready to go.
Varied shaking in the capital
Sentinel measures the shaking of the ground and compares it to the performance criteria of buildings. We also generate the maps from our sensors. In the two maps below note the difference a magnitude 5 event from 1st October in Cooks Strait had with the higher magnitude 5.8 event from Sunday 6th October. Our sensor network measures in over a hundred locations across Wellington City and more beyond. Measured shaking is shown by the overlaid colours, darker shows stronger shaking.

These varied shaking patterns are typical, we are frequently reminded that every earthquake is unique, every building performs different, and every person has a different experience in an earthquake.

You can view these maps and more from our Home page by clicking "Latest Earthquake".


SHARE